How to Visualize Energy Consumption
Posted November 7, 2014
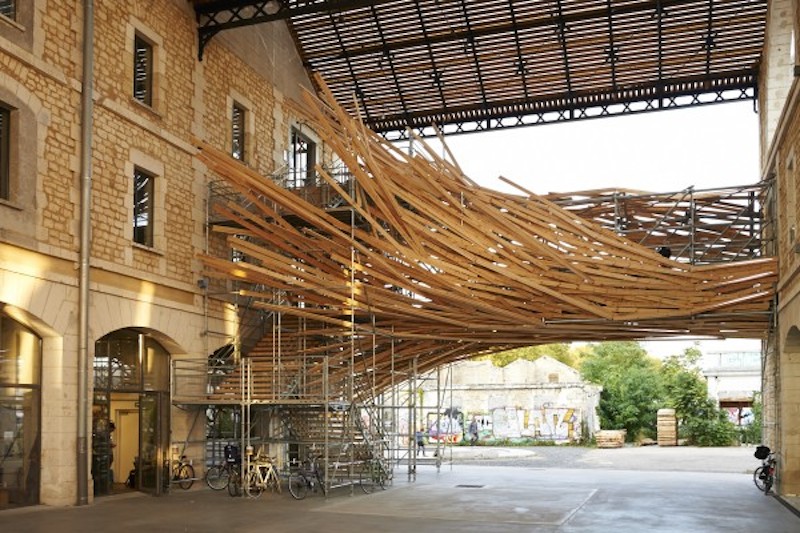
Paris-based creative studio, 1024 Architecture have created an installation for the Darwin Ecosystem Project’s building in Bordeaux that is at once art and data visualization. The Project is a mixed space that brings people together to collaborate, learn, present arts and crafts, and skateboard. 1024 calls the installation VORTEX. And in some ways it looks like what a vortex could be.
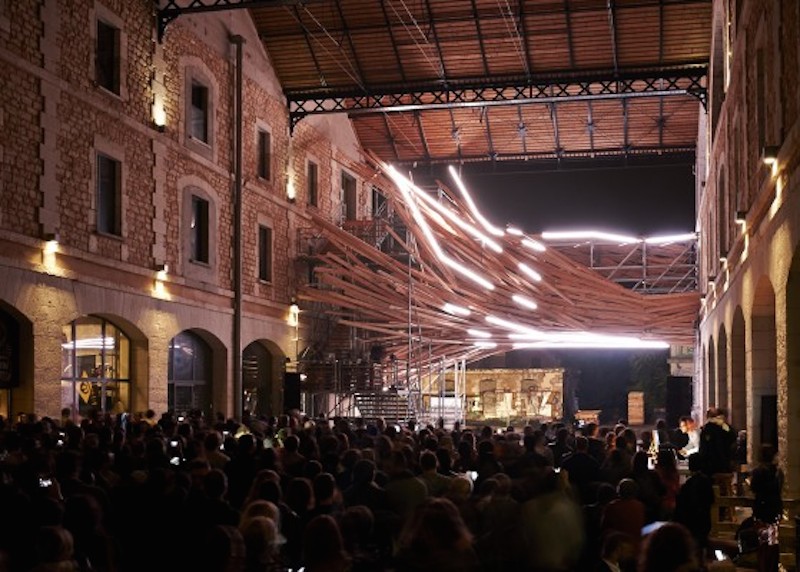
The installation is the physical connection between the two buildings. It is built from wooden beams, neon and LED tubes, and is supported on a scaffolding-like bridge. Run by custom software, the piece trembles, breathes, emits pulses of light, and all of this can be controlled by a joystick. But the ultimate aim of the project is to display the energy consumption of the building that it is connected to. The building’s consumption is monitored and turned into visuals that add meaning to the light display.
Design and art in the service of education and conservation is something ESI stands behind. It would be worth a trip to Bordeaux to see the installation in action. Or if you are in the neighborhood, make a day trip of it.
Join The Conversation